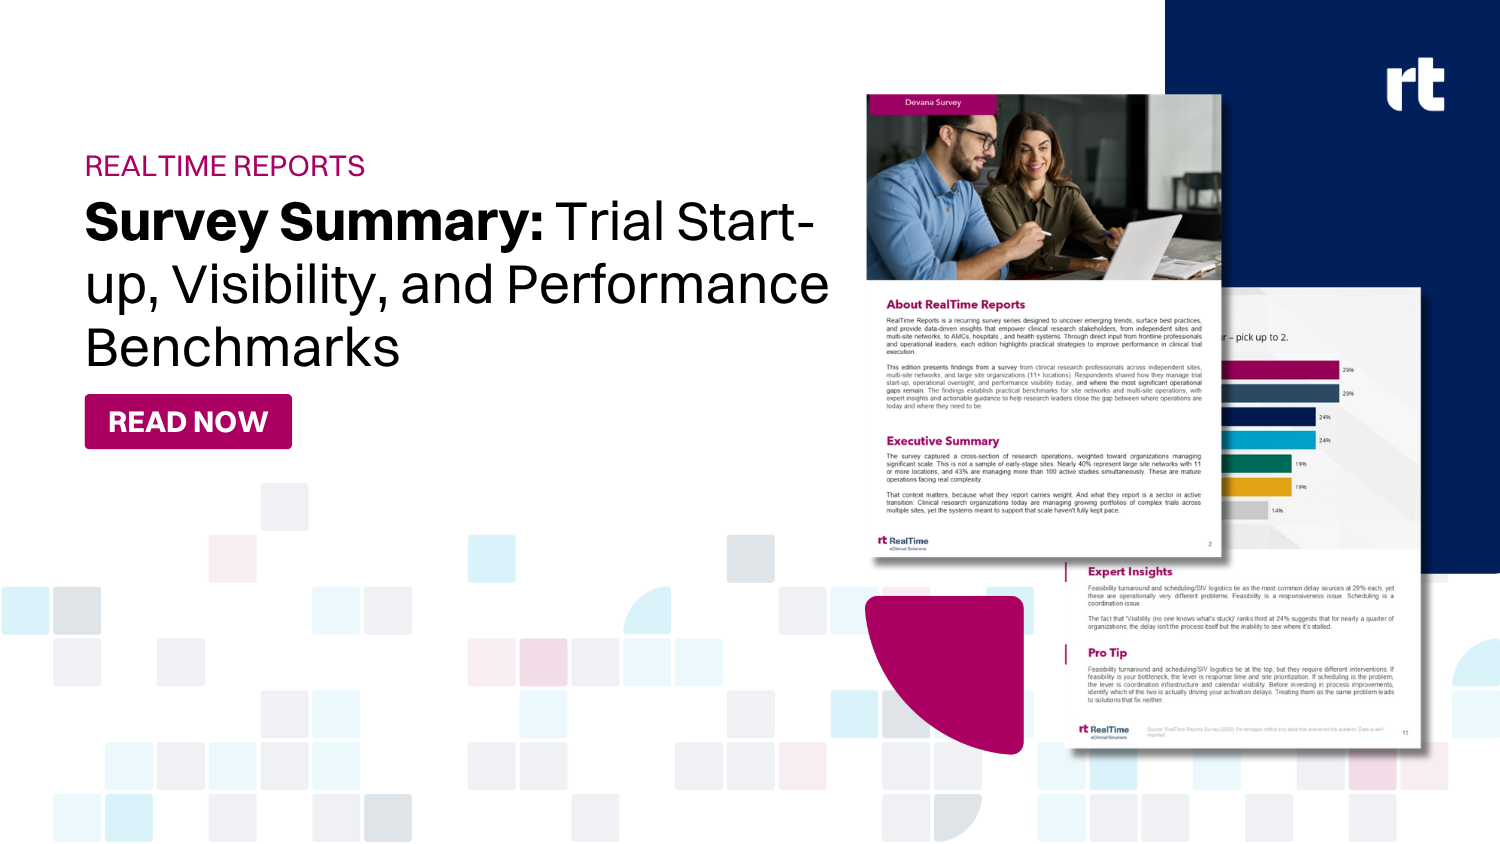
RealTime Reports is a recurring survey series that aims to uncover emerging trends, surface best practices, and provide data-driven insights that empower clinical research stakeholders, from independent sites and multi-site networks, to AMCs, hospitals, and health systems. Through direct input from frontline professionals and operational leaders, each edition highlights practical strategies to improve performance in clinical trial execution.
This edition presents findings from a survey of clinical research professionals across independent sites, multi-site networks, and large site organizations (11+ locations). Respondents shared how they manage trial start-up, operational oversight, and performance visibility today, and where the most significant operational gaps remain. The findings establish practical benchmarks for site networks and multi-site operations, with expert insights and actionable guidance to help research leaders close the gap between where operations are today and where they need to be.
Key Findings:
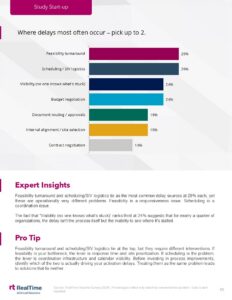
Contract and budget turnaround spans a wide range.
Just 5% finalize contract and budget negotiations within a week, 38% within 8–14 days, and 14% within 15–30 days, but nearly a quarter still average 31–60 days.
For more than half of organizations, contract and budget negotiations delay study activation at least sometimes.
Oversight data remains fragmented.
Across the sector, 76% of organizations rely on CTMS reports, 52% on spreadsheets, and 43% on email or messaging tools, with just 5% operating from a single unified platform.
Nearly 4 in 10 professionals report they only sometimes or rarely have a complete view of their trial portfolio.
Pipeline visibility gaps are top operational pain points.
Pipeline visibility gaps (48%) and enrollment visibility gaps (52%) are the top operational pain points across all respondents, outranking even study start-up delays, a finding that points directly to data infrastructure, given that three in four organizations are still capturing metrics manually or with only partial automation.
Enrollment Rate vs. Target and Time to Activation are the metrics that matter most to leadership.
Enrollment rate vs. target (81%) and time to activation (71%) are the metrics that matter most to leadership, yet 76% of organizations are still capturing those metrics manually or with only partial automation.
The ambition is portfolio-level performance management. The reality is still largely manual.
This website uses cookies to improve your experience. We'll assume you're ok with this, but you can opt-out if you wish. Cookies PolicyCookie settingsACCEPT
Privacy & Cookies Policy
Privacy Overview
This website uses cookies to improve your experience while you navigate through the website. Out of these, the cookies that are categorized as necessary are stored on your browser as they are essential for the working of basic functionalities of the website. We also use third-party cookies that help us analyze and understand how you use this website. These cookies will be stored in your browser only with your consent. You also have the option to opt-out of these cookies. But opting out of some of these cookies may affect your browsing experience.
Necessary cookies are absolutely essential for the website to function properly. These cookies ensure basic functionalities and security features of the website, anonymously.
Cookie
Duration
Description
cookielawinfo-checbox-analytics
11 months
This cookie is set by GDPR Cookie Consent plugin. The cookie is used to store the user consent for the cookies in the category "Analytics".
cookielawinfo-checbox-functional
11 months
The cookie is set by GDPR cookie consent to record the user consent for the cookies in the category "Functional".
cookielawinfo-checbox-others
11 months
This cookie is set by GDPR Cookie Consent plugin. The cookie is used to store the user consent for the cookies in the category "Other.
cookielawinfo-checkbox-necessary
11 months
This cookie is set by GDPR Cookie Consent plugin. The cookies is used to store the user consent for the cookies in the category "Necessary".
cookielawinfo-checkbox-performance
11 months
This cookie is set by GDPR Cookie Consent plugin. The cookie is used to store the user consent for the cookies in the category "Performance".
viewed_cookie_policy
11 months
The cookie is set by the GDPR Cookie Consent plugin and is used to store whether or not user has consented to the use of cookies. It does not store any personal data.
Functional cookies help to perform certain functionalities like sharing the content of the website on social media platforms, collect feedbacks, and other third-party features.
Performance cookies are used to understand and analyze the key performance indexes of the website which helps in delivering a better user experience for the visitors.
Analytical cookies are used to understand how visitors interact with the website. These cookies help provide information on metrics the number of visitors, bounce rate, traffic source, etc.
Advertisement cookies are used to provide visitors with relevant ads and marketing campaigns. These cookies track visitors across websites and collect information to provide customized ads.